Architecture
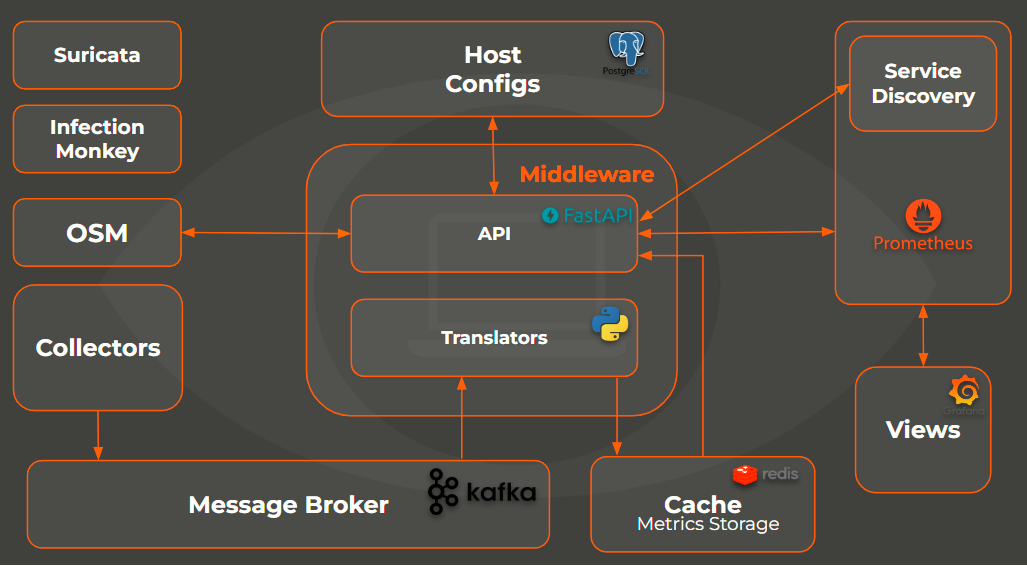
Our system has a microservices architecture, based in several independent modules that work together.
We wanted to create a system where the information was centralized in a unique format and stored in a unique database cluster. Our middleware is the most important piece of the game, because it makes everything comunicate and work as it should. All metrics have to go through our middleware before being exported to Prometheus. This allows us to easily change our storage location and/or system. Our API provides all the information needed to monitorize the system, so we could easily change from Grafana to another visualization system.
The deployment process foresees the necessity of scaling, implementing more modules or launching more workers if a part of the system is overloaded.
Service Discovery
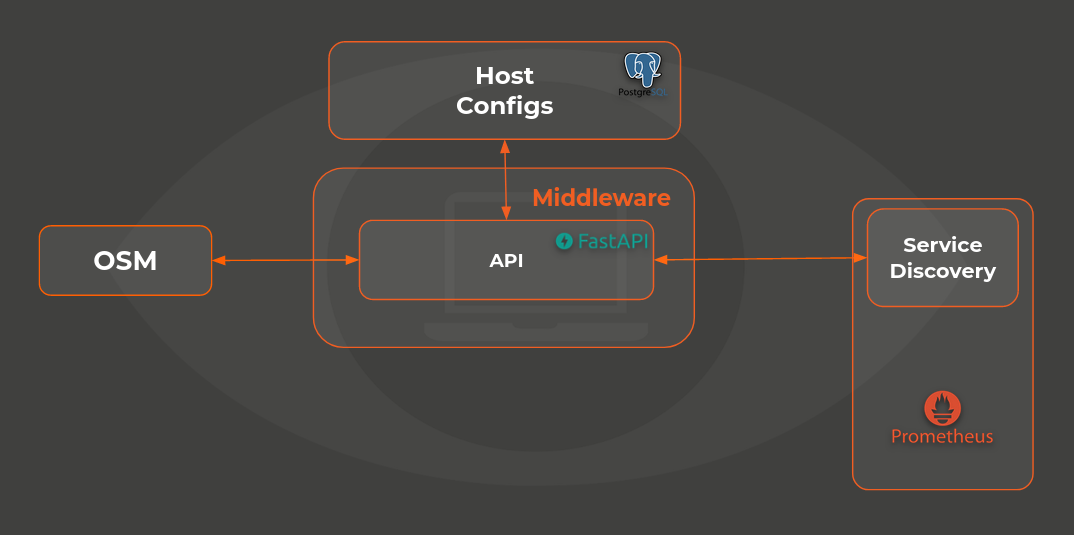
Service discovery is the process of learning which are the active VNFs from where we can collect metrics. For that, we ask our MANO for this information, persist it on a PostgreSQL database and then from time to time Prometheus asks our API for the list of targets.
See how we configured our Service Discovery.
Metrics Collector
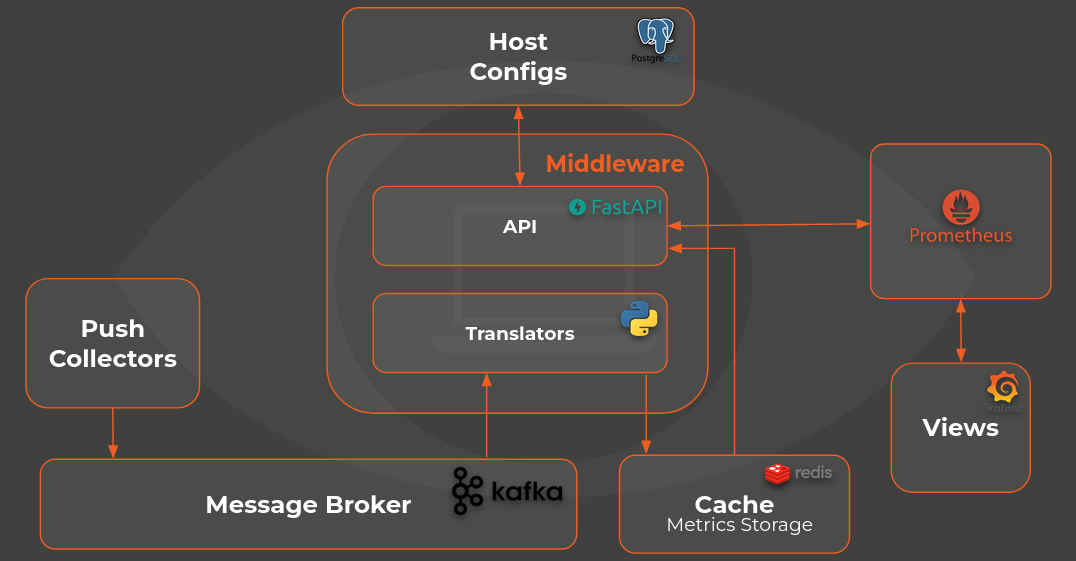
Our system has to be listening for every push to avoid losing information. We connected our collectors to a Kafka broker and developed translators to transform the messages into Prometheus language. After the translation process, the metrics are stored in a Redis database that acts as our cache. When prometheus asks for metrics related to a machine we go to redis and return the information stored under that machine's ID.
To check wether a machine has Pull or Push collectors we consult our PostgreSQL database where the main configs are stored.
See how we configured our Metrics Collection Service.
See how to develop your own Metrics Translator.